
In this article
Key Takeaways
| Strategy | Buy low and sell high |
| Application | Manual on Exchange (eg. Binance) Trading Bot (eg. Pionex) |
| Advantages | Exploiting Market Volatility Expectation: «Fluctuate and then bullish» |
| Risks | The price falls and does not recover. In this case, you bought high and sold low. Wrong setting: Grids set too tight causing the transaction fee to suck up the profit. |
In the beginning, I was a classic hodler. I always bought a fraction of BTC and ETH at the end of each month and waited for the market to rise – which it did. When Elon Musk directed the market with his (stupid) Twitter posts about BTC and Dogecoin, I started to dump some of my BTC. Actually, I prefer to buy when the bears are at work and wait for the Greater Fools to join who are then ready to buy my overpriced assets. And so I got bored during the bull market….
The idea of Grid Trading
So I started with an Excel spreadsheet. My idea:
- Whenever the market falls by 10%, I buy BTC for a certain amount ➞ eg. $100
- If the price then rises back by 10%, I sell the previously purchased BTC again ➞ eg. sale $110 (Profit $10)
- But if the price drops by another 10%, then I buy BTC again for the same amount ➞ eg. $100
Side note: In other experiments I bought at consecutive dumps of 10% each also for 10% more of the original amount (eg. $110). But to understand the principle of grid trading, this is less relevant.
And so I created the following Excel tables, which I called «Trading» at that time, because I had no idea about Grid Trading.
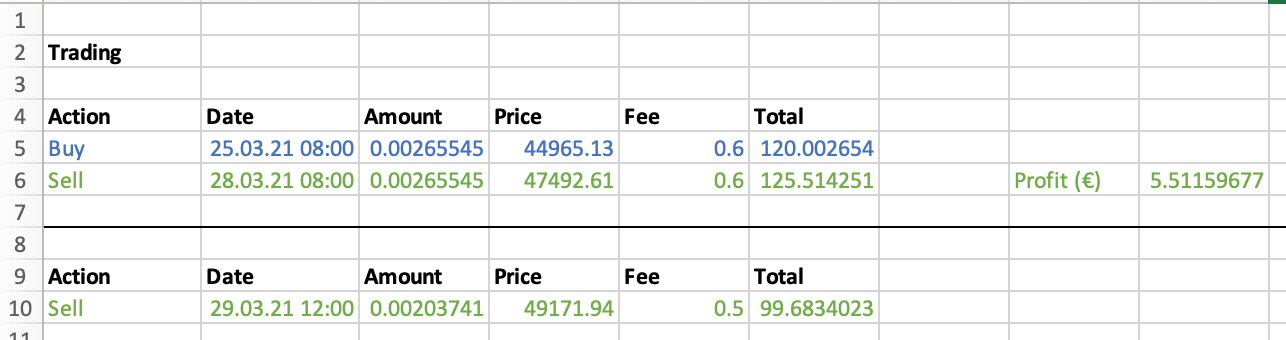
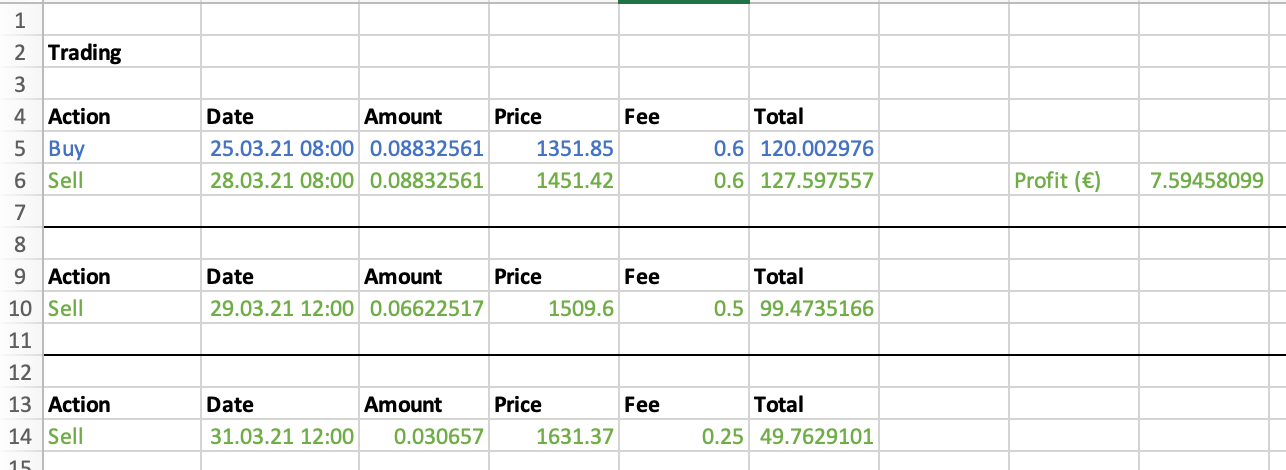
The tables show that I started testing right during a rising market movement. Therefore, my examples list almost exclusively sales.
If one puts these sales or the potential buys on the chart, the «grid» becomes visible.
(The following graphic is unrelated to my Excel screenshots above.)
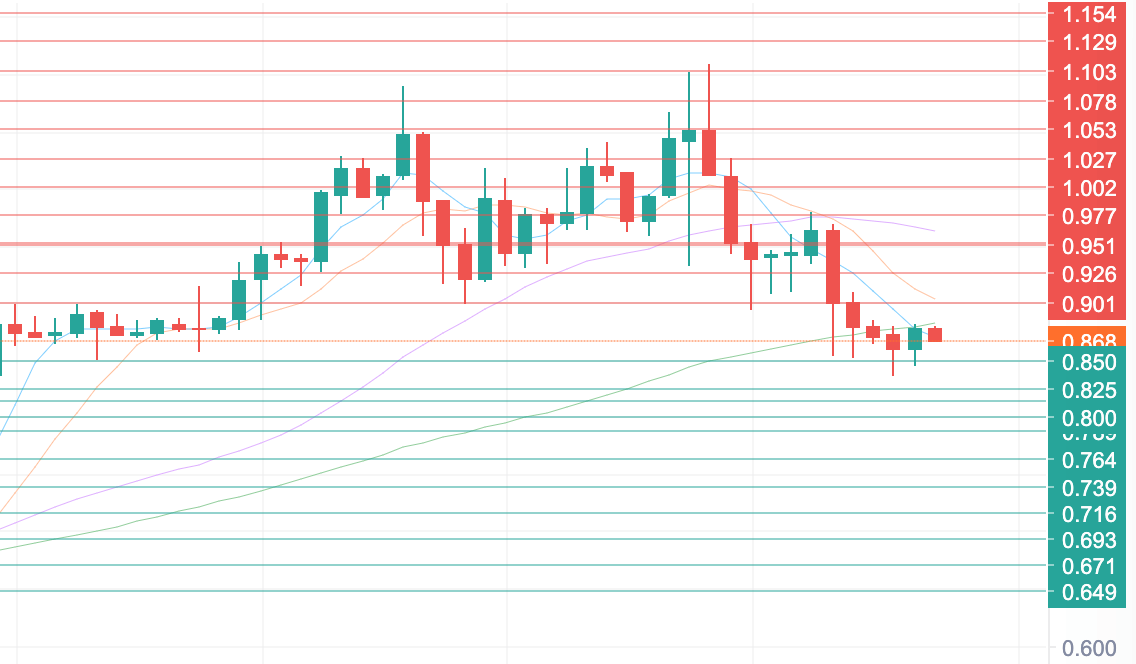
The screenshot shows the buy and sell orders created in the order book for the trading pair BTC3L/USDT. The created buy orders (green) and sell orders (red) represent the grid, which was relevant for naming the trading strategy.
Side note: BTC3L is a so-called Leveraged Token whose prices often range between 0.1 and 3. Thus, the prices of the leveraged tokens do not reflect the prices of the base currency (e.g. BTC). Leveraged tokens are available on Binance as well as on Pionex: Binance: Review of the Largest Crypto Trading Platform
Automate Grid Trading Strategy with Trading Bot
If you visit my blog or Twitter profile from time to time, you know that I am a fan of Pionex. And so it didn’t take me long to find the right trading bot for grid trading on Pionex.
Follow me on Twitter and get regular updates about new posts.
A trading bot makes it unnecessary to set price alerts to execute your trading tactics with the correct buy and sell prices. It also allows you to set the grid tighter. In my manual test, I tried it with huge price gaps of 10%. However, since the trading bot is fully automated and can therefore act quickly, price gaps of less than 1% are easily possible.
To start a grid trading bot, the following parameters are relevant:
- Cryptocurrency / Trading Pair
- Lower price limit
- Upper price limit
- Number of grids
Setup of a Grid Trading Bot
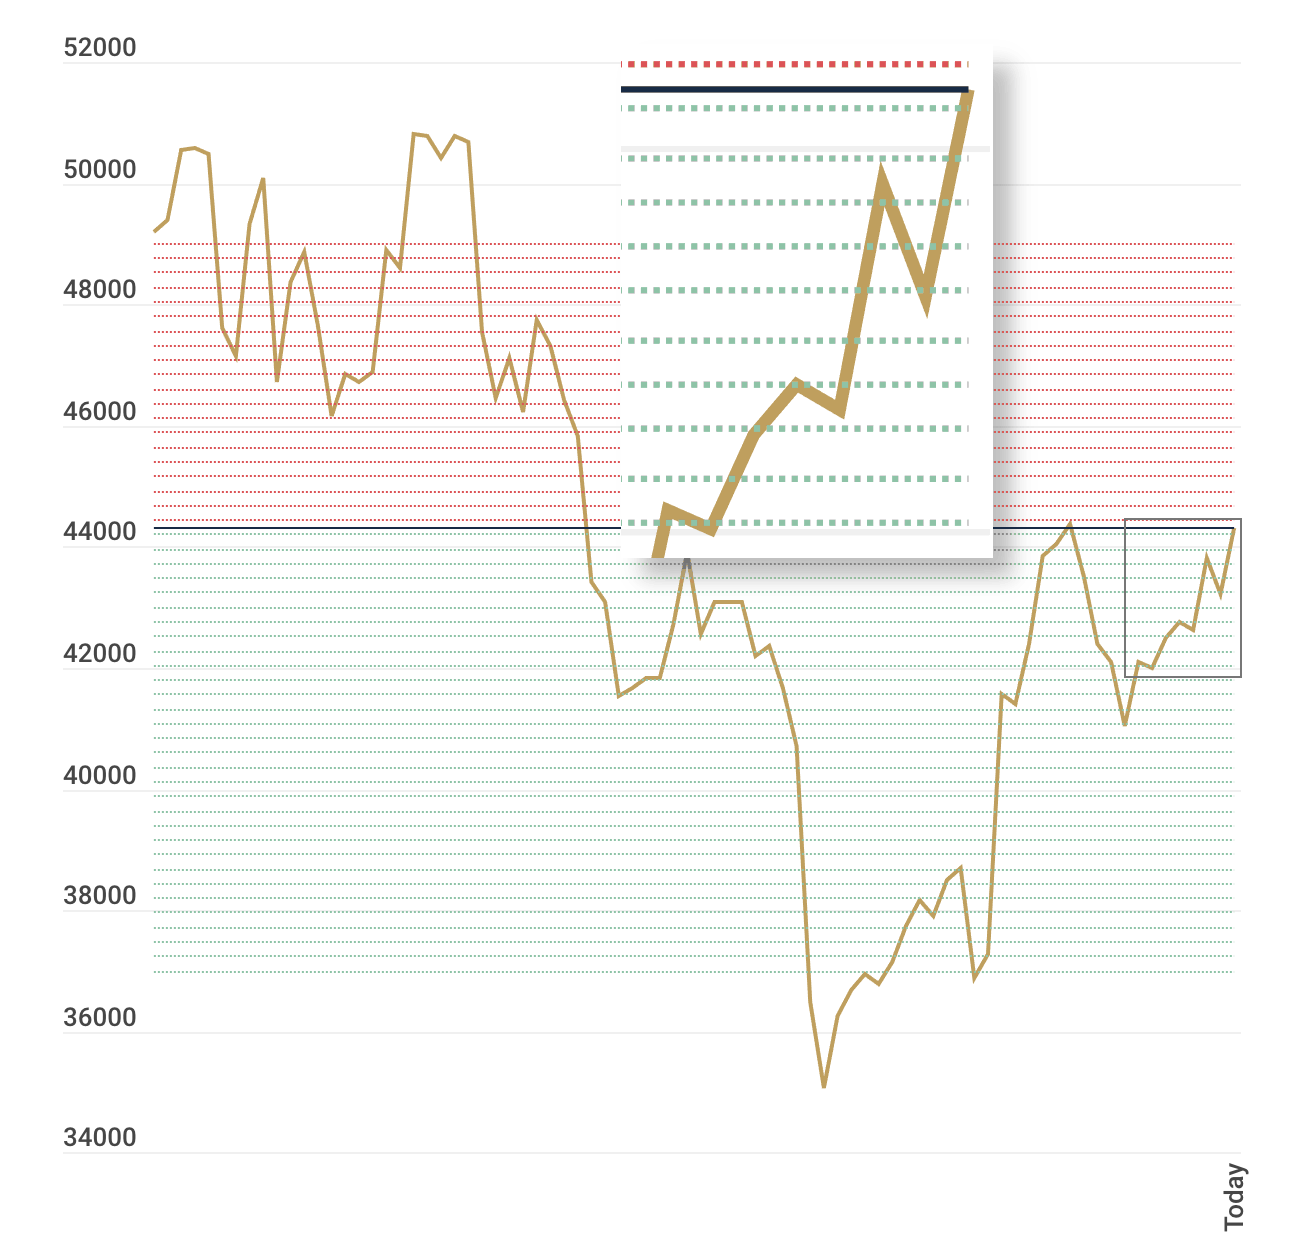
Let’s assume we want to start a trading bot for Bitcoin with counter currency USDT (trading pair BTC/USDT). The Bitcoin price is 42,000 USDT. In addition, we define the following parameters:
- Lower price limit: 37’000 USDT
- Upper price limit: 49’000 USDT
- Number of grids: 50
This results in a grid with price intervals of 240 USDT. (Or 0.49% to 0.65%, because 240 USDT are 0.49% of 49’000 USDT and 0.65% of 37’000 USDT).
If the price moves to $44,300, the trading bot executes the sell orders and replaces them with buy orders.
If the price again falls below a line of the grid, the bot executes the corresponding buy order and replaces it with a sell order.
Investment and profit
If you start grid trading with an investment in USDT, then the bot initially changes 50% to BTC (or the currency you have chosen for the bot). Obviously, this results in a 50:50 ratio at the beginning (50% BTC and 50% USDT).
If the price increases, the ratio changes so that a part of the BTC is sold and thus more USDT are available. In addition, the rest of the BTC, which the bot does not sell, has more value. Since the price has risen in the meantime.
If the price falls in return, the trading bot buys some BTC with the existing USDT. Overall, the existing BTC have less value in this case. The matter becomes clearer with an example scenario.
Let’s have another look at the parameters from above:
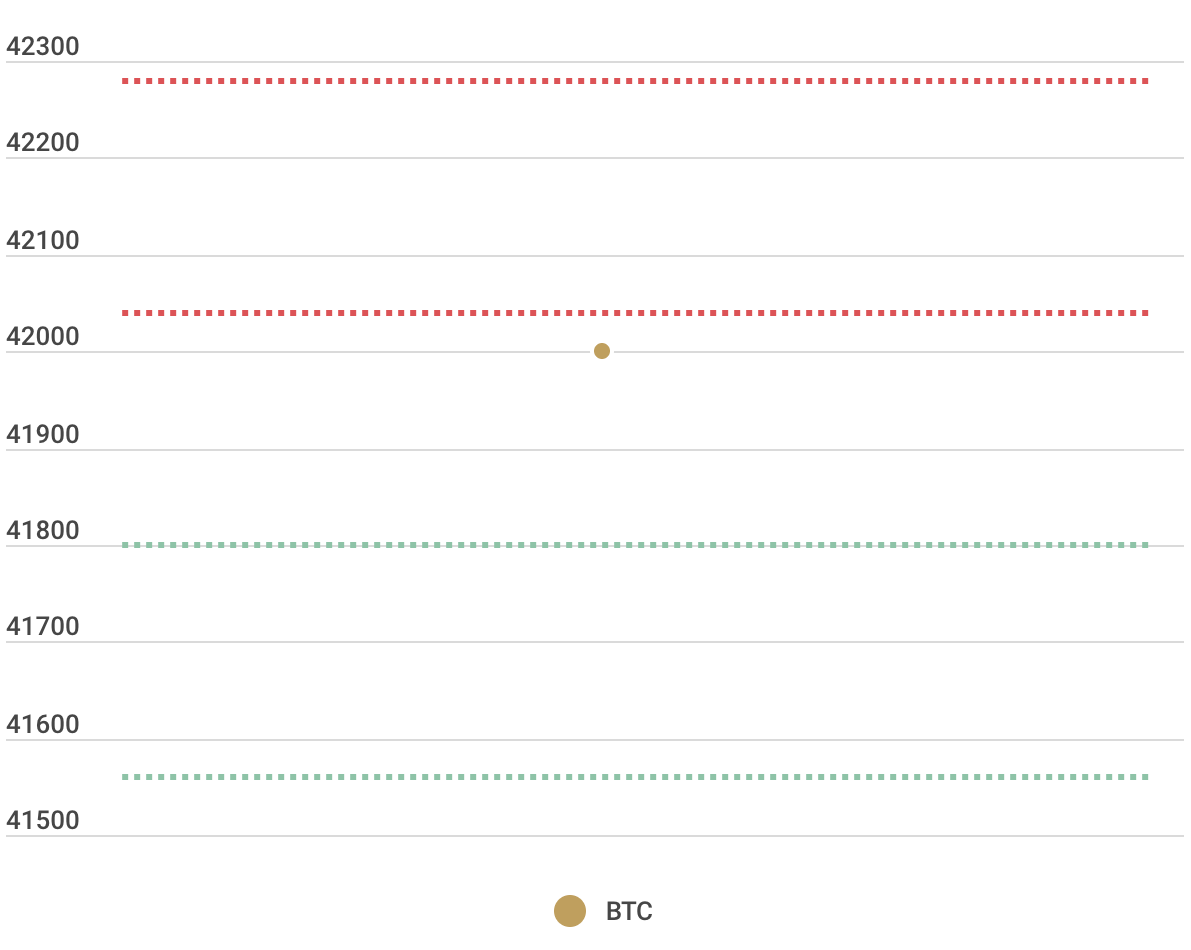
- Current price: 42’000 USDT
- Lower price limit: 37’000 USDT
- Upper price limit: 49’000 USDT
- Number of grids: 50
This results in the following situation:
- Price difference per grid: 240 USDT:
(49’000 USDT – 37’000 USDT) / 50 Grids = 240 USDT - Consequently, the next sell line is at 42,040 USDT:
37’000 USDT + 21 * 240 USDT = 42’040
(Or, to put it another way: Which price in 240 USDT increments starting at 37,000 USDT is the next higher of 42,000 USDT?) - The next buy line is therefore at 41,800 USDT:
37’000 USDT + 20 * 240 USDT = 41’800 USDT oder
42’040 USDT – 240 USDT = 41’800
(Or put another way: Which price in 240 USDT increments starting at 37,000 USDT is the next lower of 42,000 USDT?)
Given these conditions, we start a grid trading bot with 100 USDT.
The bot splits the invested USDT directly into BTC and USDT. In other words, it buys BTC worth 50 USDT, which corresponds to about 0.0012 BTC at a price of 42,000 USDT.
Example: Price change 1
Now let’s assume that the price rises to $42,110 USDT and thus the price breaks through the $42,040 USDT line. Since there were 25 sell lines above the starting price, the bot sells 4% (1/25 = 0.04) of the previously bought BTC.
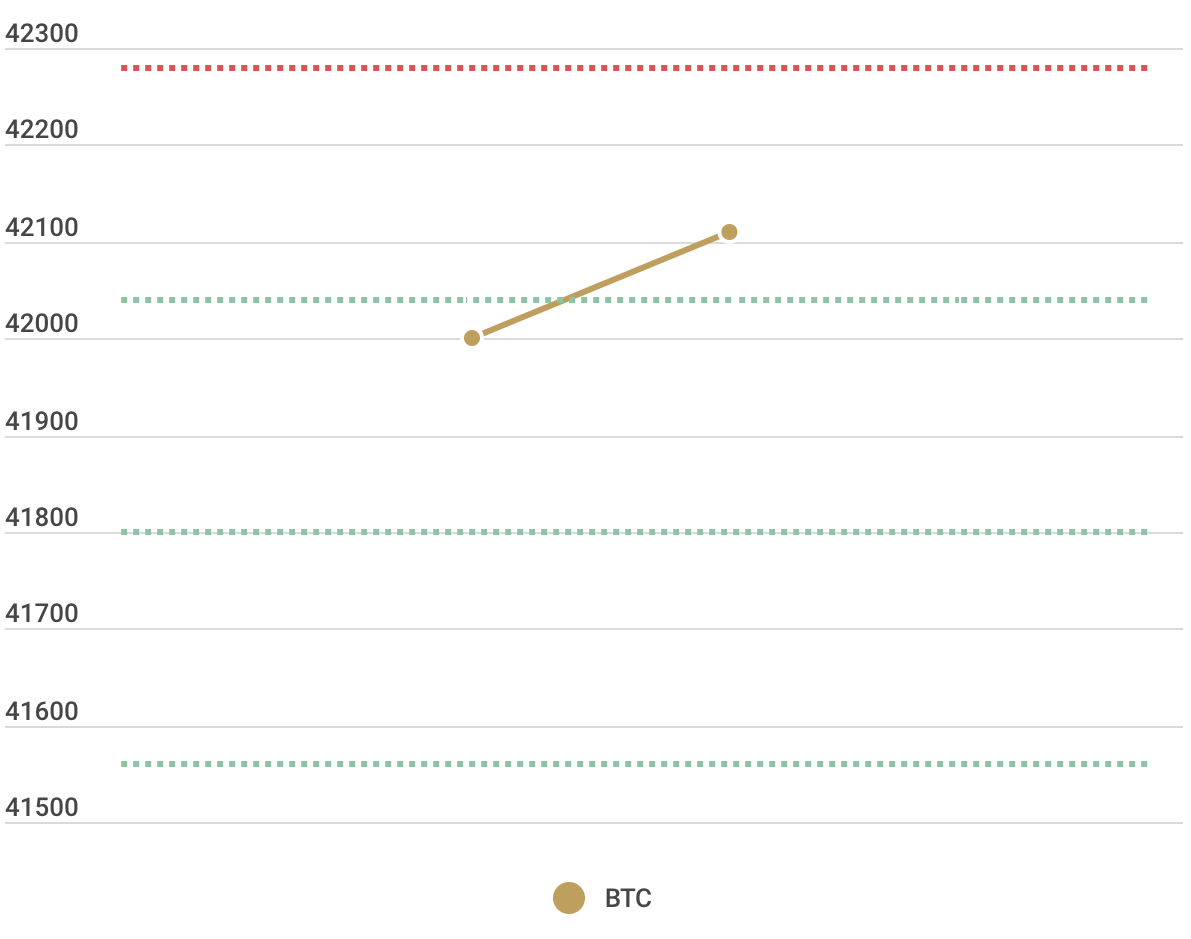
Through this action, the trading bot has made the first profit:
- 4% of 0.0012 BTC is 0.000048 BTC
- The 0.000048 BTC was previously bought by the bot for 42,000 USDT.
- The 0.000048 BTC has just been sold by the bot for 42,040 USDT.
- This results in a profit of 0.002 USDT (0.000048 BTC * 42,040 USDT – 0.000048 BTC * 42’000 USDT = 0.00192 USDT)
In summary, the state after step 1 is as follows:
- Available BTC:: 0.001152 (0.0012 – 0.000048)
- Available USDT: 50.002 (50 + 0.002 Profit from step 1)
- Number of sell lines: 24
- Number of buy lines: 26
Example: Price change 2
Let’s assume that after that the Bitcoin price drops to 41,750 USDT and falls down through the next two lower buy lines.
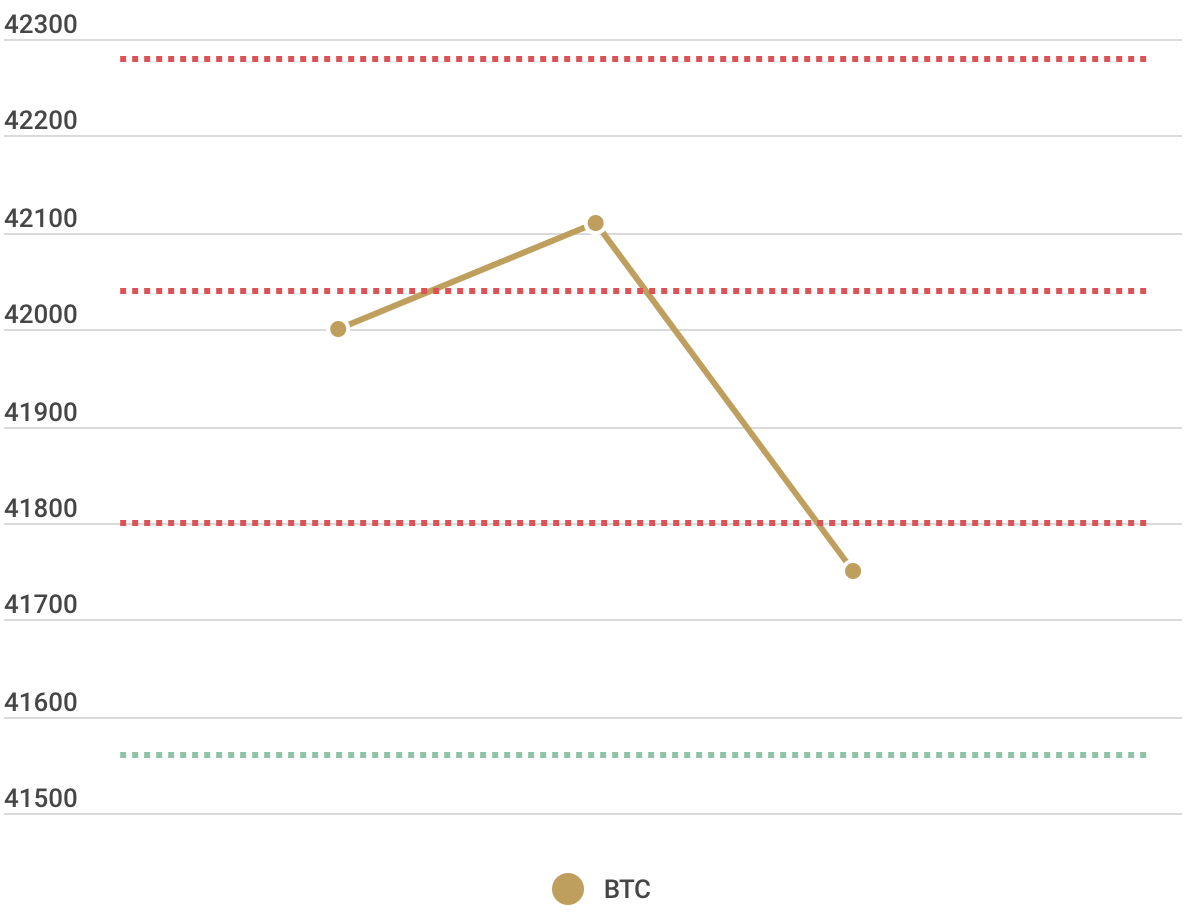
Consequently, the algorithm performs the following two steps:
- Buying Bitcoin for 2 USDT (52.002 USDT / 26 Kaufslinien) at a price of 42,040 USDT = ~0.0000476 BTC
- Buying Bitcoin for 2 USDT (~50.002 USDT / 25 Kaufslinien) at a price of 41,800 USDT = ~0.0000478 BTC
This results in the following state after price change 2:
- Available BTC: 0.0012474 (0.001152 + 0.0000476 + 0.0000478)
- Available USDT: ~46.002 (50.002 – 2 – 2)
- Number of sell lines: 26
- Number of buy lines: 24
The average price of all BTC bought is 42,000.60 USDT
(0.001152 BTC * 42,000 USDT + 0.0000478 BTC * 42,040 USDT + 0.0000478 BTC * 41,800 USDT) / 0.0012474 BTC = 42,000.60 USDT
In case the price continues to fall, the trading bot would buy BTC according to the strategy and try to sell them again at a later time.
Upper price limit: The desired state
It is relatively clear that the price of the selected cryptocurrency will not stay within the defined price limits forever. Thus, it may happen that the price breaks through all the sell thresholds upwards. In this case, the entire amount of previously purchased BTC is sold and only USDT is left.
This is the desired state using a grid trading bot. Pionex describes the target behavior of the price as «Fluctuate and then bullish», which means nothing more than that first the volatility is exploited and then all BTC are sold at a higher price.
In this state, it no longer makes sense to let the algorithm continue running. It would be possible for the price to fall back into the grid price range and for the bot to profit from the volatility there. However, since all BTC have already been sold successfully, it makes more sense to simply stop the bot and start a new one with a different price range.
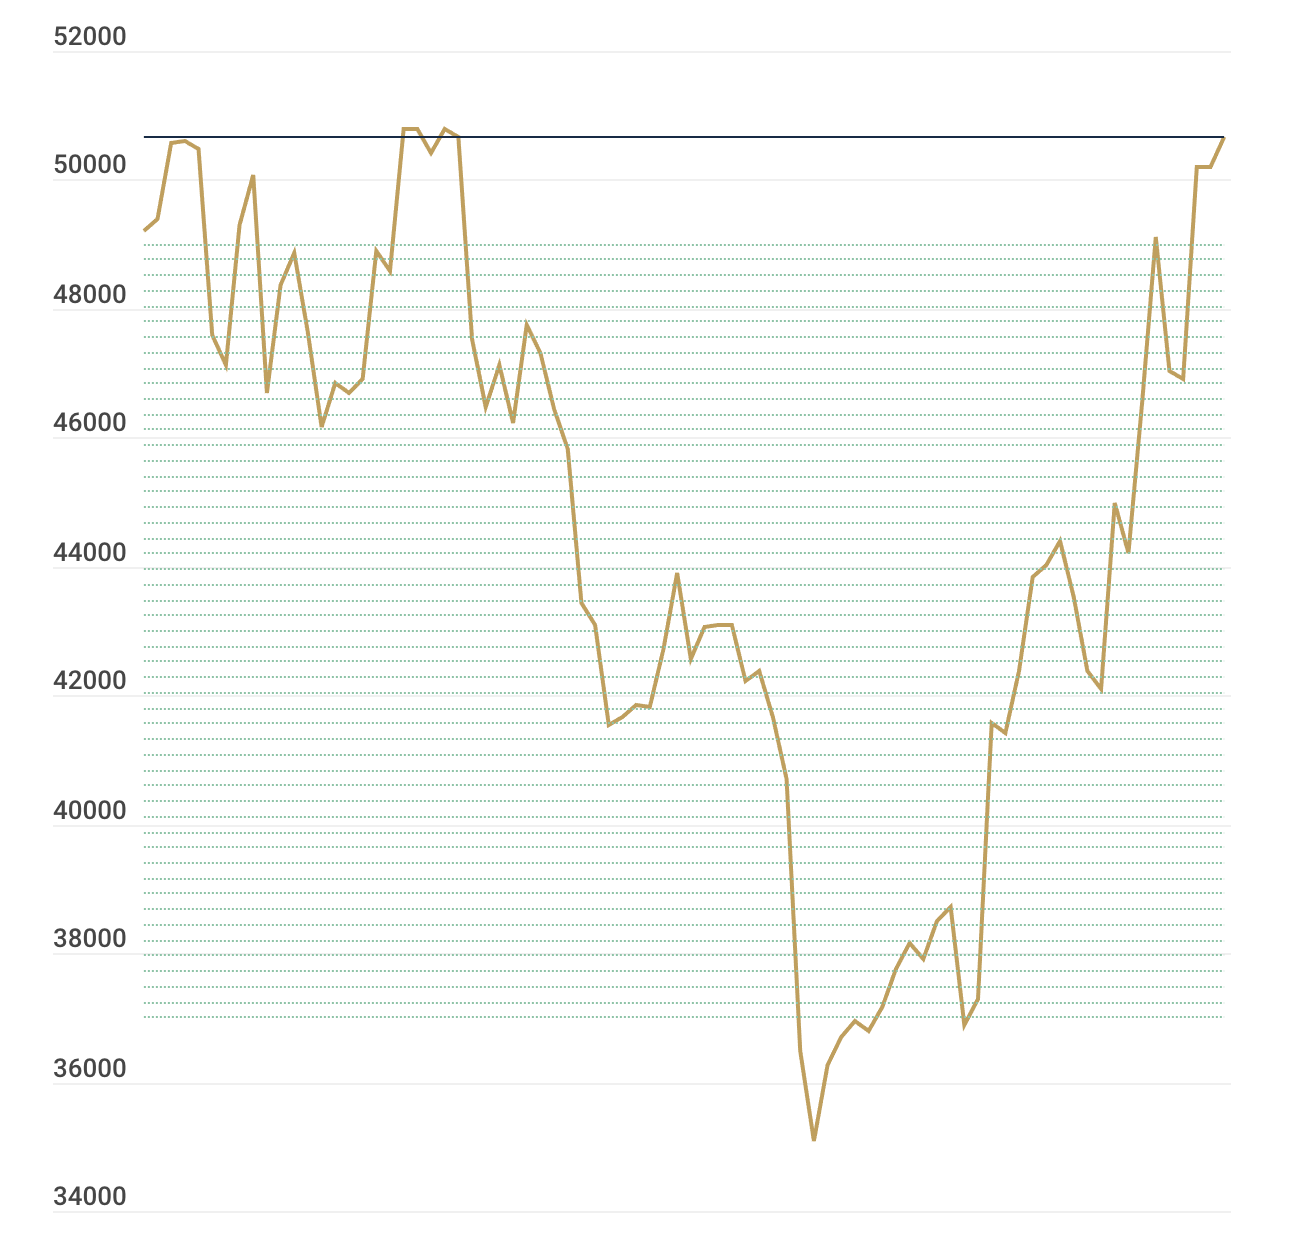
Lower price limit: The undesired state
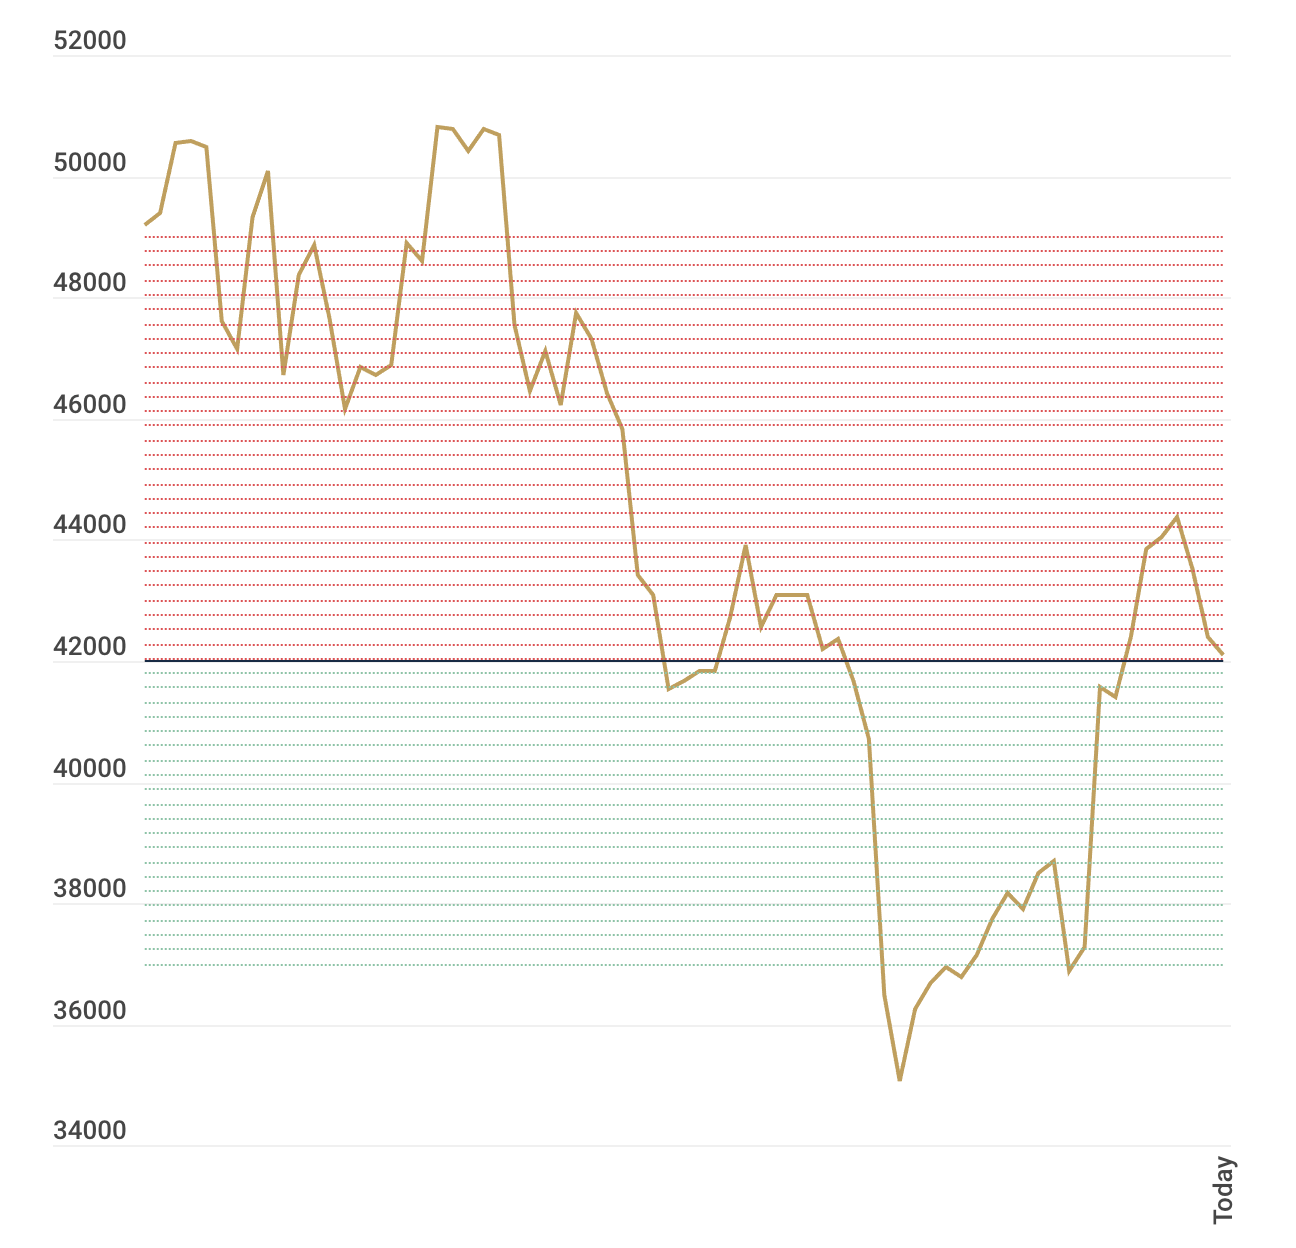
Of course, it can also happen that the price changes against your expectations. In this case, if the price slips below the lower price limit, the situation looks as follows.
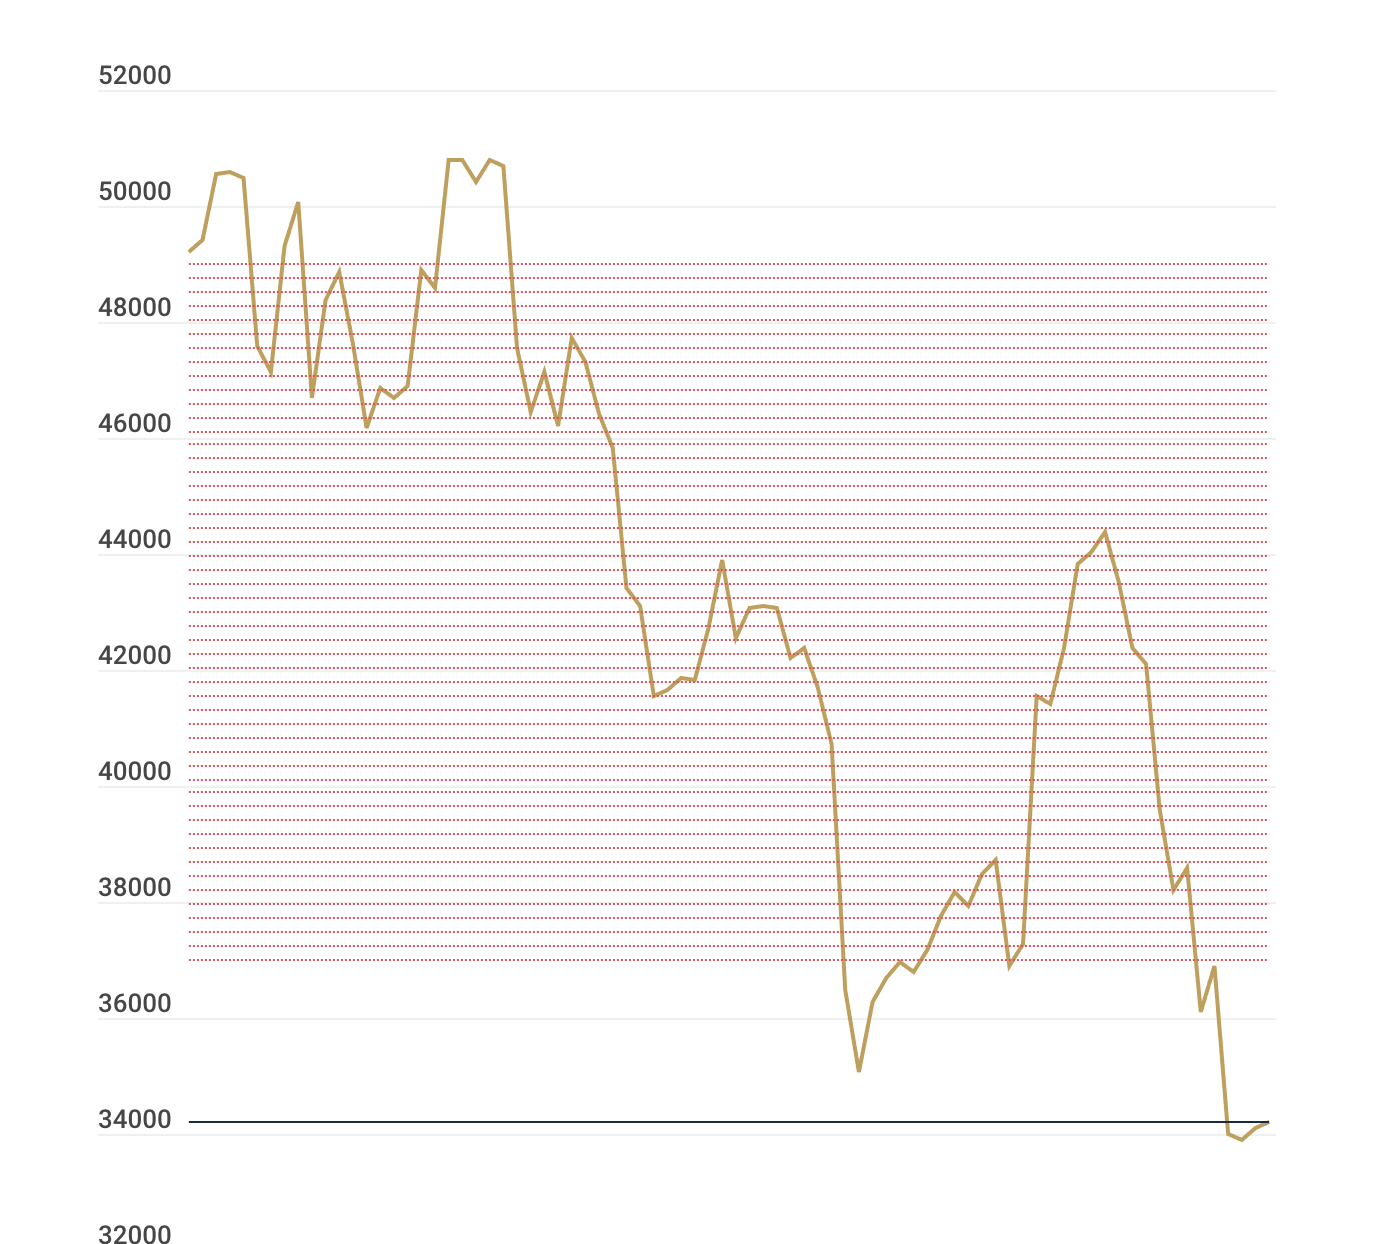
In this case, when the sell lines were hit, the algorithm exchanged all existing USDT for the selected cryptocurrency (eg. BTC). Moreover, the price has continued to fall, causing all purchased BTC to lose additional value. In contrast to a buying BTC without grid trading, at least the average cost price has moved downwards, which somewhat limits the damage:
Let’s assume you would have bought BTC for 100 USDT without a grid trading bot and the price would have dropped to 34,200 USDT as shown in the chart. In this case you would have a price loss of 7,800 USDT (42,000 – 34,200). In case of using a grid trading bot, the repetitive purchases would have pushed the average initial price down so that it would be between around 38,000 and 40,000 USDT. This only corresponds to a price loss between 3,8000 and 5,800 USDT.
Measures in case of negative price development
If you find the trading bot in this state, you have the following options:
- Stop bot, sell all BTC and take loss.
- Stop bot, keep all BTC and hodl.
- After stopping the bot, start a new one with new price limits to further exploit the volatility.
- Keep bot running until the price moves back into the defined price range.
If you go for option 1, then you have to strongly consider whether what you are doing is the right thing for you. In this case, you would definitely not have planned your investment clearly enough in advance.
Option 2 is basically possible. This way, you can at least still tell yourself that you got the Bitcoin cheaper than if you had bought the same amount right at the beginning.
In option 3, it should be noted that by stopping the algorithm, you collect the losses and then start a new bot with less liquidity. Since the algorithm already lost part of your investment.
Number 4 is the behavior that I would recommend. For some reason, you started the bot. If you don’t expect the value of the currency to move above the lower price range in the future, then it is not advisable to start a grid trading bot in the first place. Besides that, sometimes you should let your investments rest and not try to optimize things permanently. (Note to myself 😇).
Stop Loss and Take Profit
Instead of waiting for the bot to reach an appropriate level and then stopping it manually, there is also the option to set a Take Profit price. In this case, the bot will automatically liquidate all positions and exchange the purchased BTC into USDT if the price reaches the desired price.
As a counterpart to Take Profit, there is obviously also Stop Loss. Here you define an additional (undesired) price at which the assets will be sold automatically. In this case, however, rather to prevent too large losses.
Hands-On: Grid Trading on Pionex
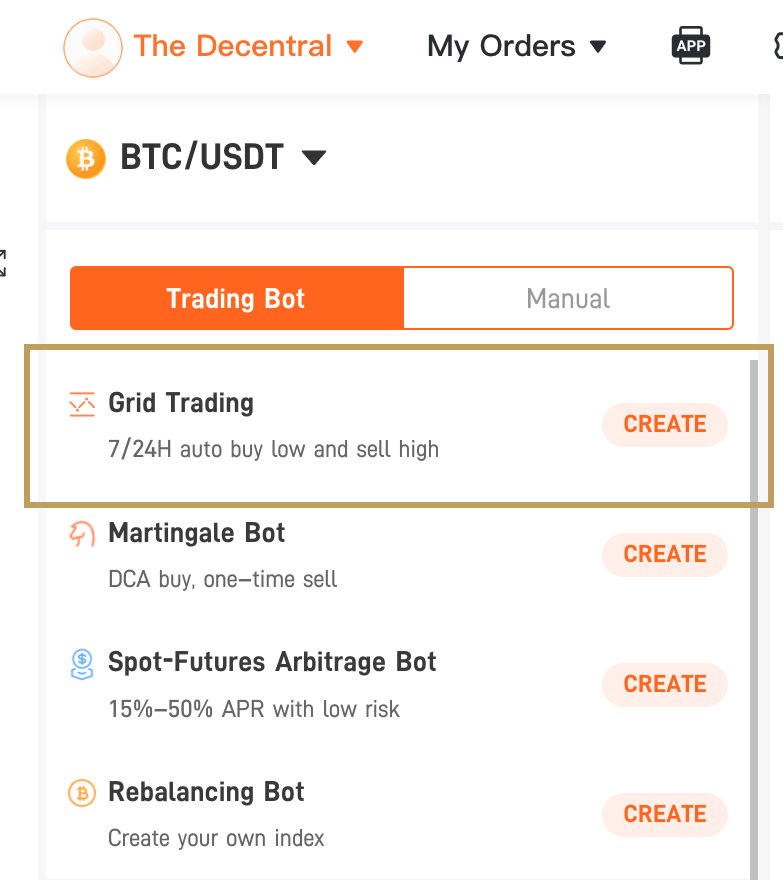
Pionex offers a whole range of trading robots. In my article Pionex Arbitrage Bot: Your Smart Investor I have already described one of these trading bots. However, the following instructions will help you to start your first grid trading bot.
Create your account on Pionex here
and benefit from the lowest trading fee of 0.05%.
After creating an account on Pionex, the first thing you need to do is choose the currency you want to start the bot with. It is recommended to choose one with a lot of liquidity. One of the top 100 by market capitalization should offer this liquidity.
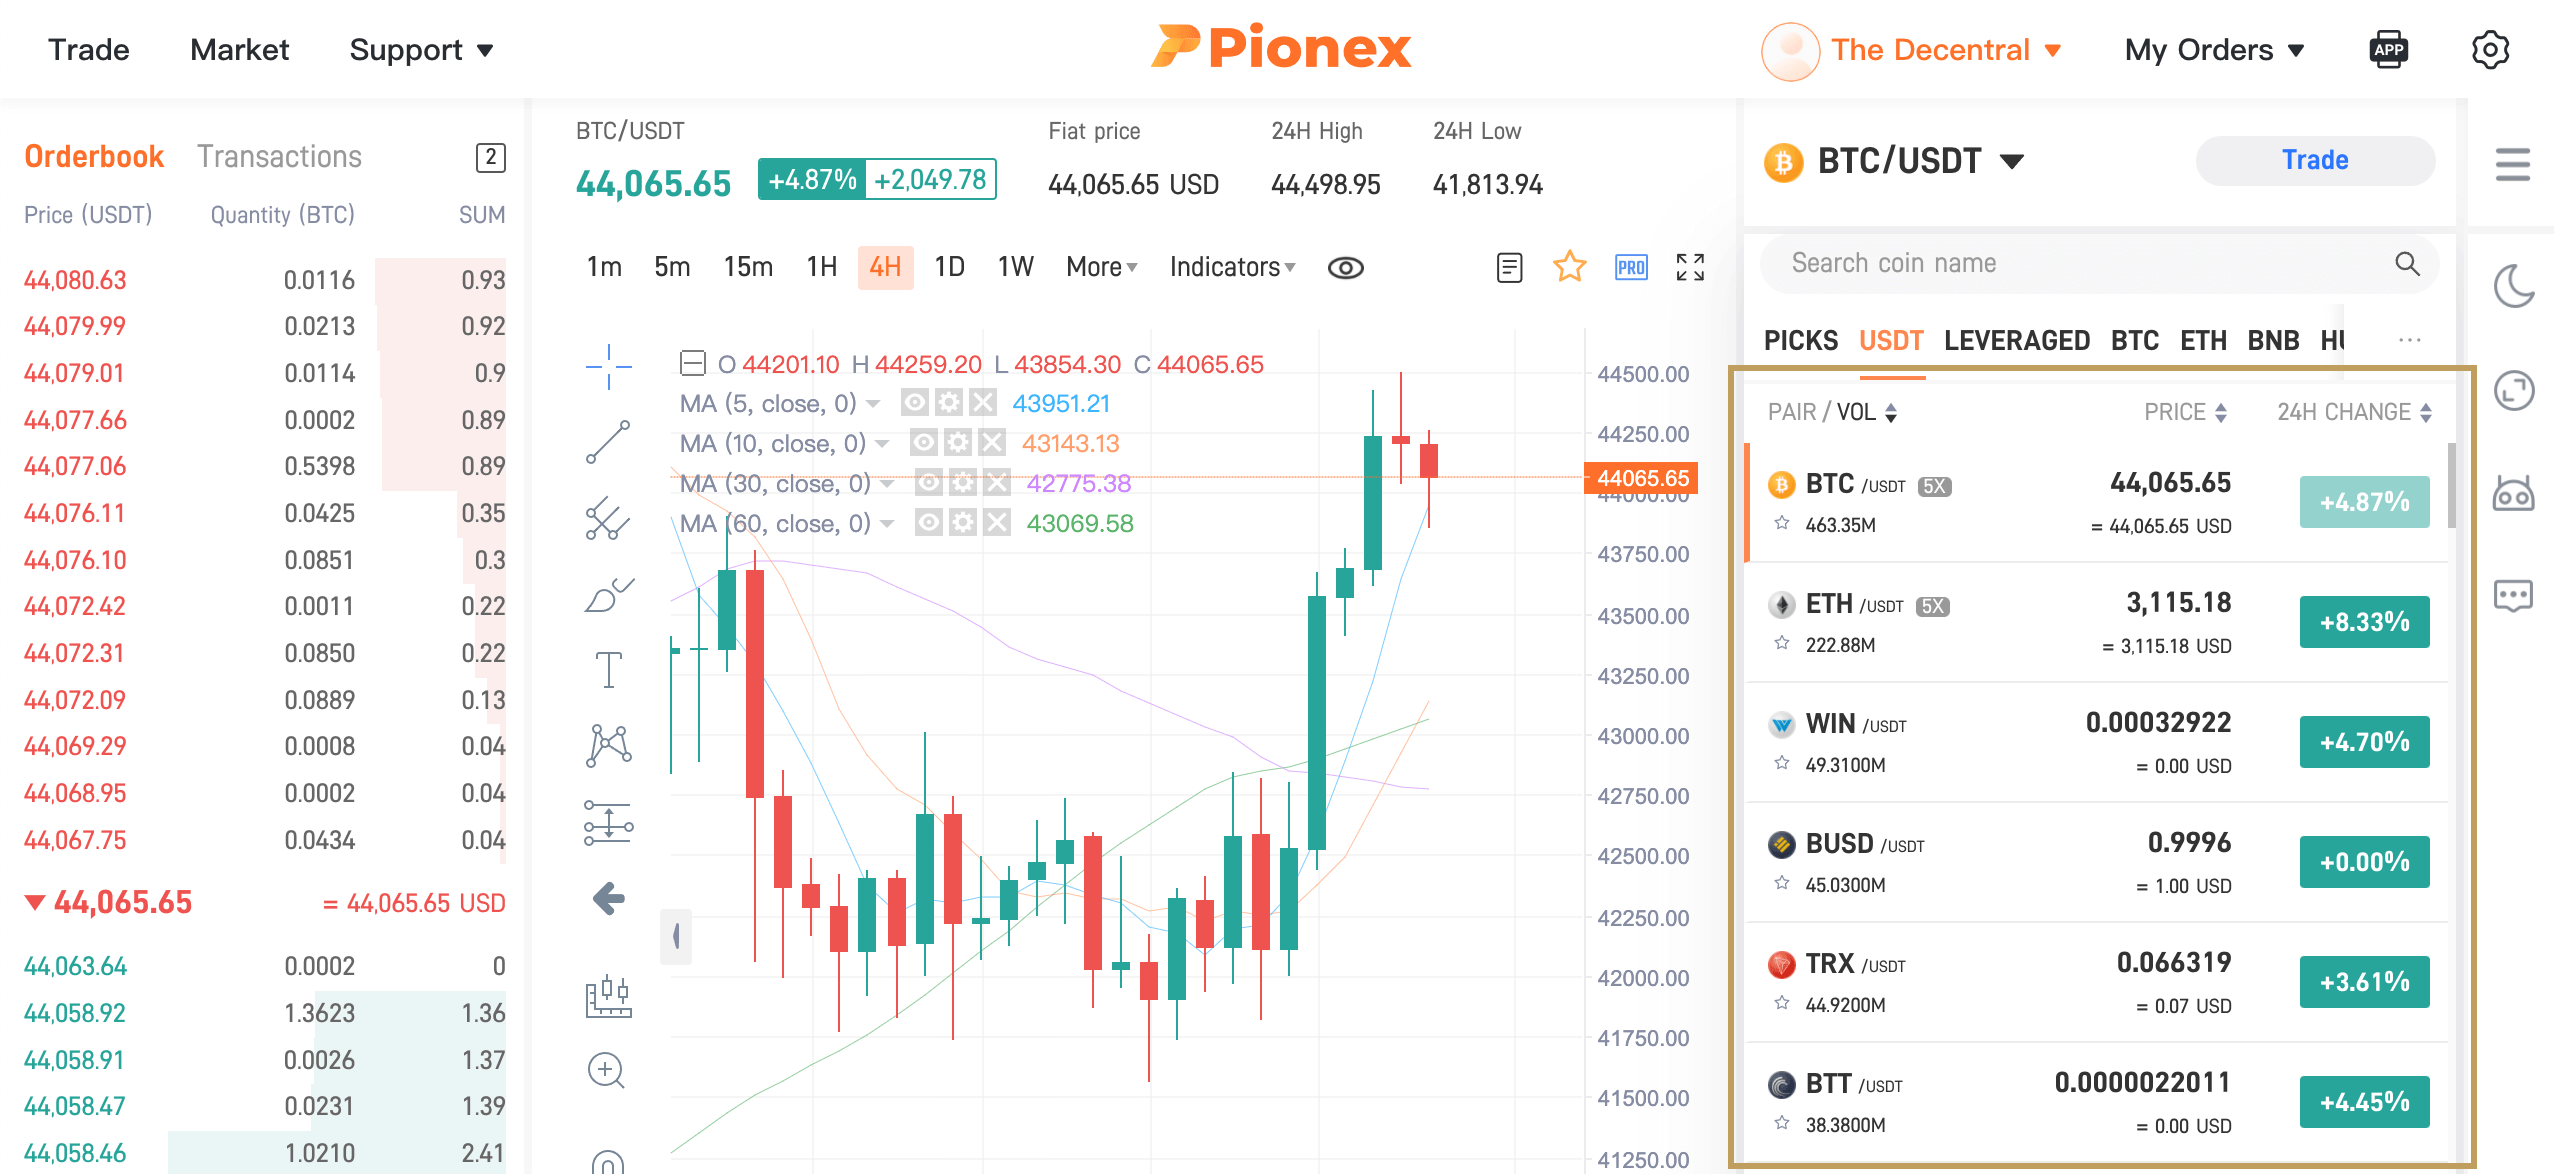
With the currency selected, the running grid trading bot is just a few clicks away.
Pionex proposes parameters that the platform finds favorable based on past price development. For this reason, the configuration is also labeled as «AI Strategy».
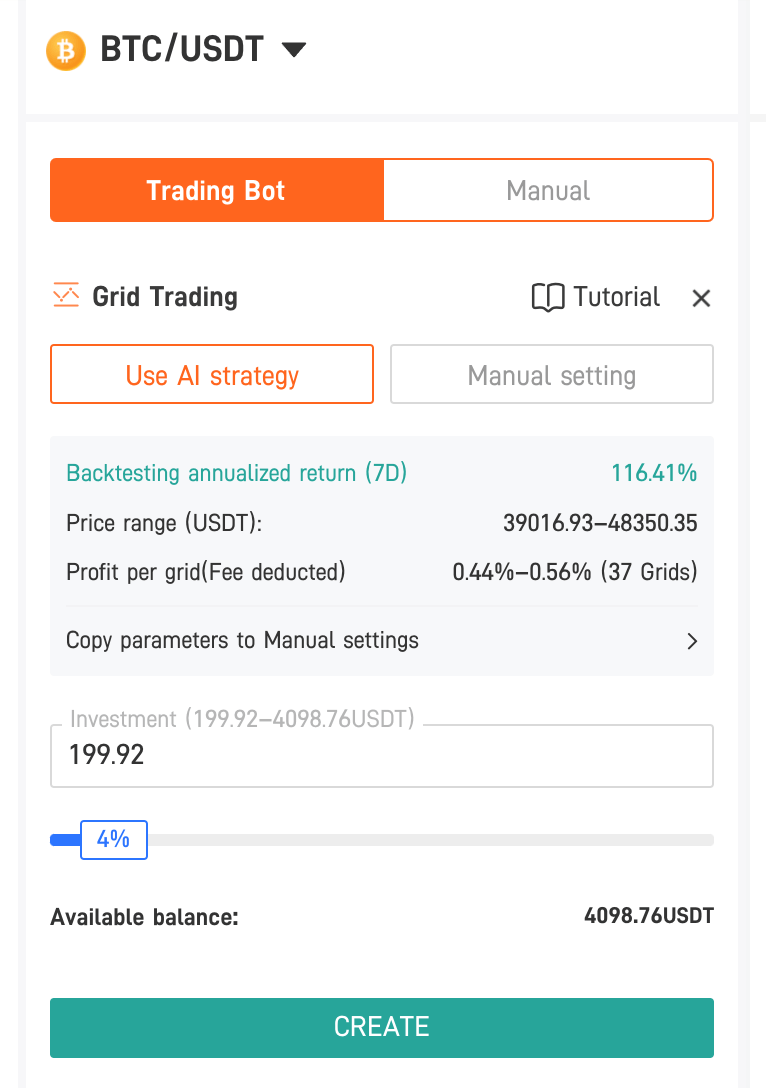
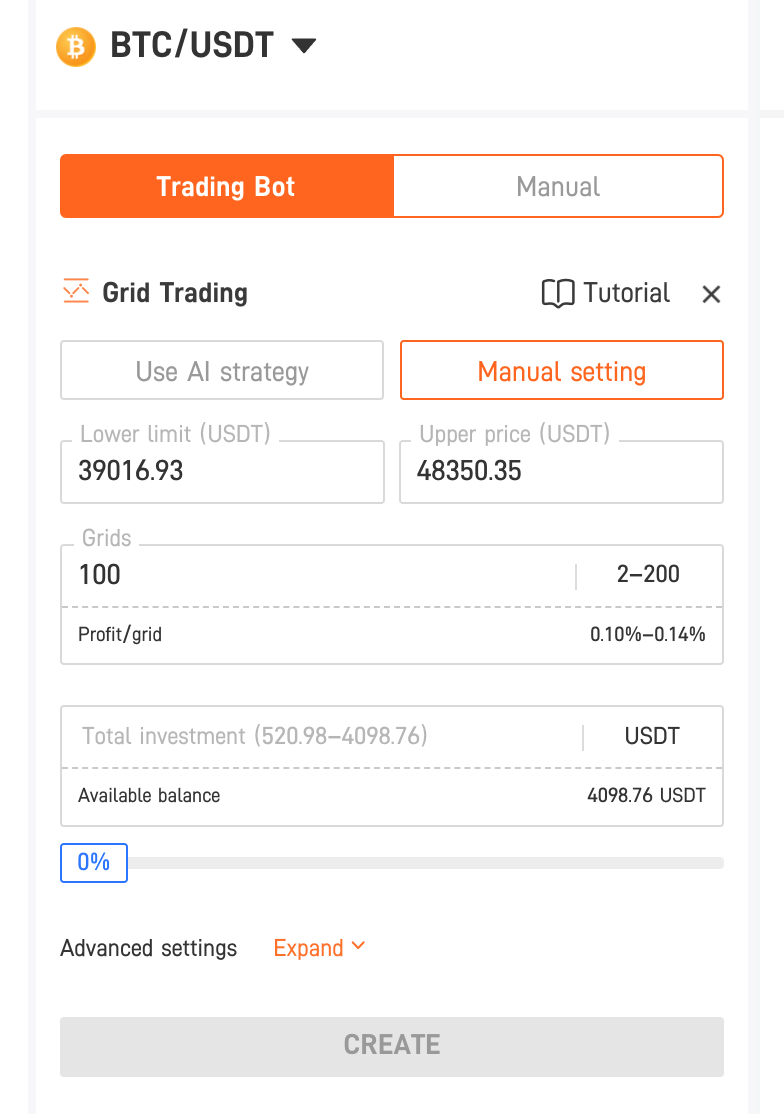
With the parameters defined by Pionex, a profit of 0.44 – 0.56% per grid can be achieved. But if you want to set the price range wider or narrower, you have the possibility to choose «Manual setting». Or even easier is to click on «Copy parameters to Manual settings». This will copy the AI parameters to the manual configuration of the bot, where you can adjust them to your preferences.
Clicking on “Create” starts the rocket 🚀 and Pionex will begin to convert half of the invested USDT into the target currency.
Check activities and profits of the Grid Trading Bot
While the trading robot is running, the order book can be viewed at any time. The price movement is visible, which will lead to the the next action (buy/sell).
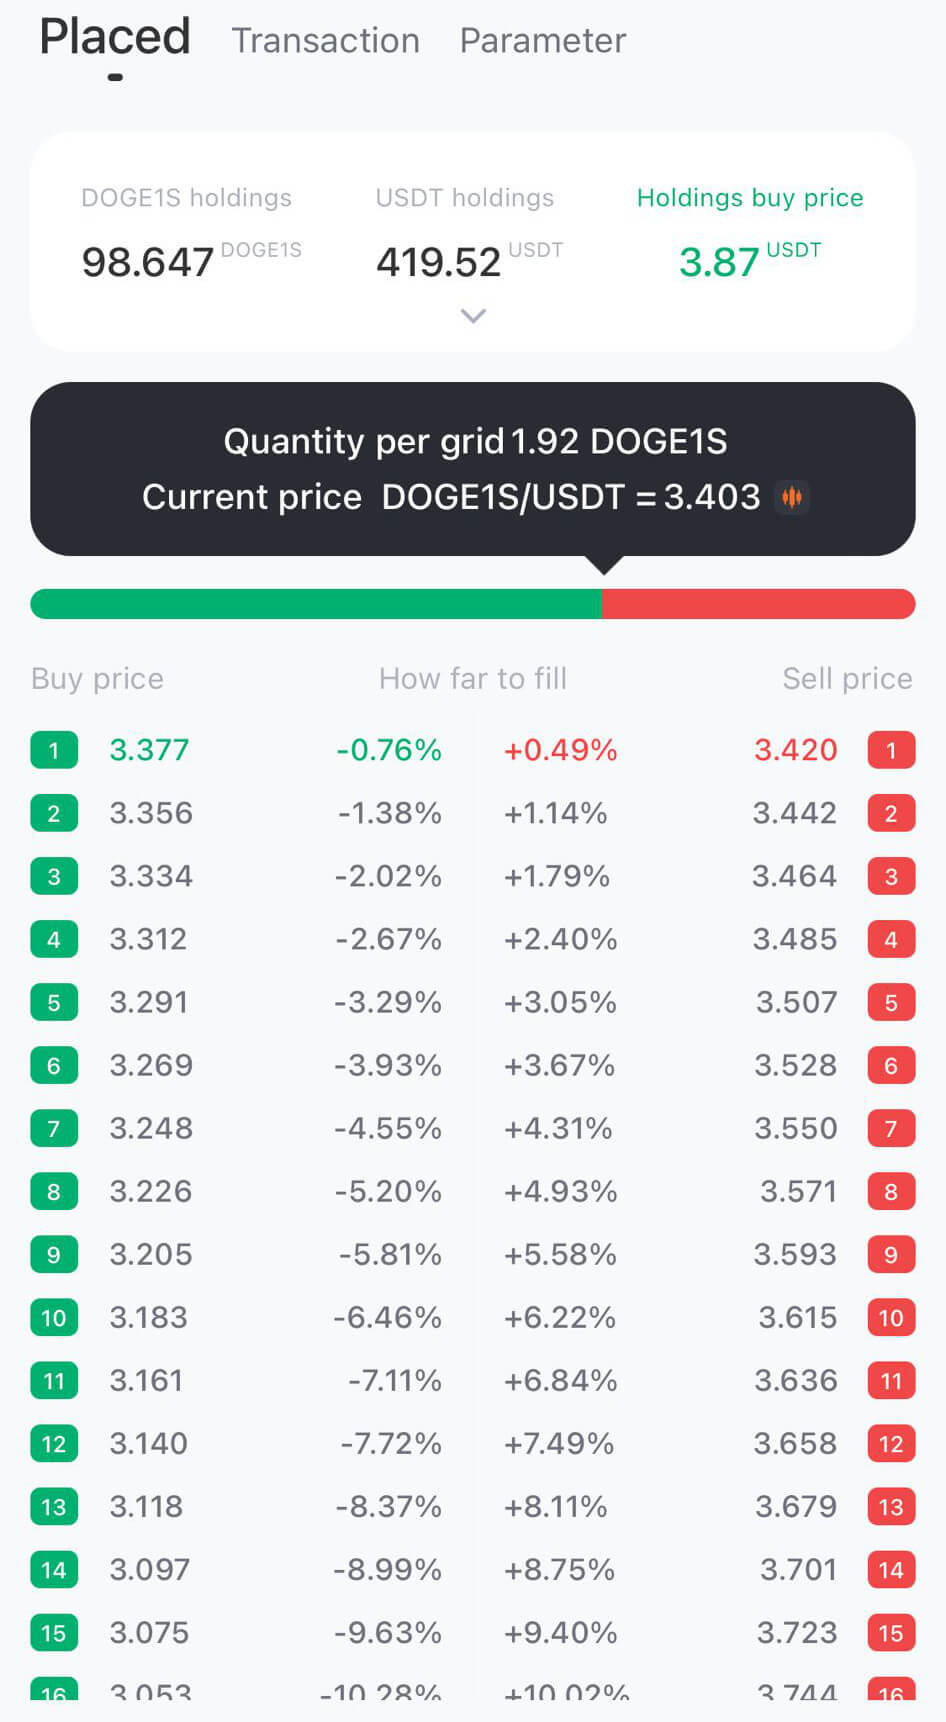
In the example above, the price would have to fall by 0.76% for the price to break through the next buy line which would lead the algorithm to buy a small amount of the selected currency. In turn, an automatic sale takes place if the price rises by 0.49%.
The transactions listing (Transaction tab) shows the purchases and sales made by the bot. You can see that each sale is paired with a purchase. Each such pairing shows the profit gained from it.
Buy actions, after which the price has not increased by the predefined percentage, are indicated in the list with «To be sold». This remains the case until the price reaches the expected level. In the meantime, it takes profits from the lower buy and sell lines. And finally, this is the beauty of Grid Trading Bot:
The Grid Trading Bot has a plan B for every situation
After the bot has been running for a while, you can cash out a portion of the profit the algorithm generated.
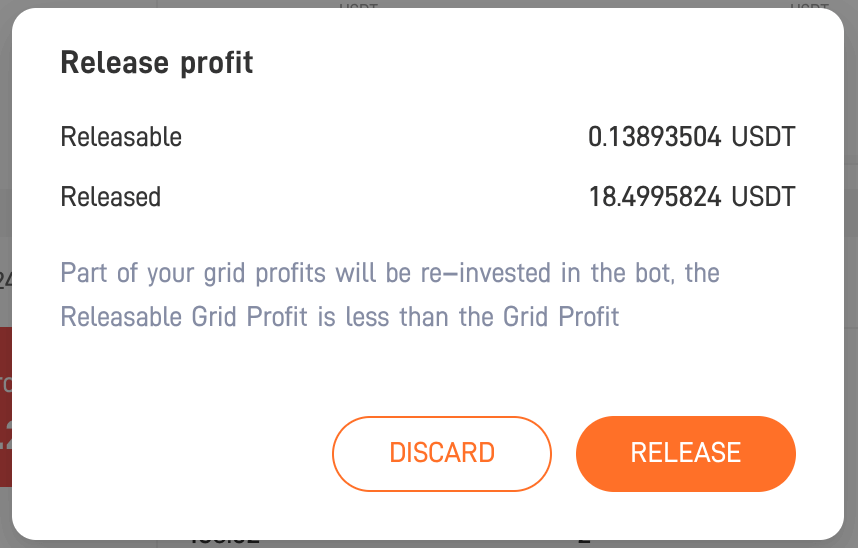
The dialog clearly shows that the bot only releases part of the profit. The algorithm automatically reinvests the other part in further transactions.
Important: The listed profit in no way says that the algorithm was profitable overall. If the price of the cryptocurrency drops significantly, then depending on the scenario, the price will fall below the average cost price, resulting in a loss. Nevertheless, in the meantime, the bot trades out small profits through grid trading. In summary, the profit is calculated as follows:
Whereby the Price_Profit can also be negative obviously. The grid profit is positive at any time.
Conclusion
I have tried grid trading bots with many currencies and in most cases their profits were in my favor. Nevertheless, it also happened that my investment slipped below all buy lines for weeks and patience decided whether I would take a massive loss or still be able to turn it into profit.
One approach I try to take in all of my investing is to always have a Plan B. The grid trading strategy inherently takes this approach. By using a trading bot, you can also save yourself a whole load of stress and at best rarely check their status.
Binance also offers grid trading bots. Over there, these bots are called “Strategy Trading”. You can find my review here: Binance: Review of the Largest Crypto Trading Platform